EU Imports €95.3 Billion in Energy in Q1 2025:In the first quarter of 2025, the European Union imported €95.3 billion worth of energy products, but total volumes declined by 3.9% to 176.4 million tonnes. A sharp surge in liquefied natural gas imports contrasts with falling petroleum volumes, reflecting shifting energy strategies and supplier dynamics.
EU Imports €95.3 Billion in Energy in Q1 2025 Despite 3.9% Drop in Volume: LNG Soars 45.3% in Value
In the first quarter of 2025, the European Union imported energy products valued at €95.3 billion, amounting to a total volume of 176.4 million tonnes. Compared to the first quarter of 2024, this marks a slight increase of 0.3% in import value, while the volume declined by 3.9%, indicating rising prices or a shift towards higher-cost energy sources.
A detailed comparison with Q1 2024 shows a decline in both value and volume of petroleum oil imports. The value fell by 11.9%, and the volume decreased by 8.0%, indicating reduced dependency or changing market preferences.
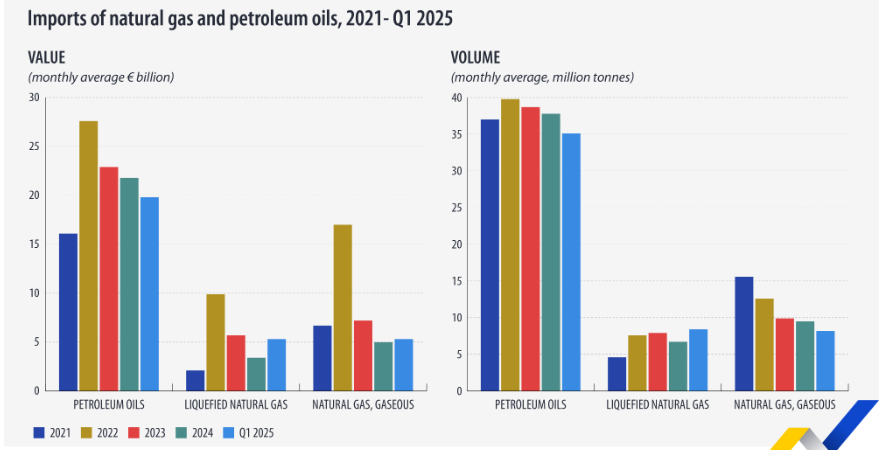
When looking at monthly averages, petroleum oil imports in Q1 2025 stood at about €21 billion, down from approximately €23 billion in 2024 and nearly €28 billion in 2022. The volume dropped to around 35 million tonnes per month, lower than the nearly 39 million tonnes recorded in 2022.

By contrast, liquefied natural gas (LNG) witnessed strong growth. The value of LNG imports in Q1 2025 rose by 45.3% year-on-year, and the volume increased by 12.1%. Monthly average figures show a sharp rise in LNG value, reaching close to €10 billion in Q1 2025 from just under €6 billion in 2024, and up from less than €3 billion in 2021. The import volume of LNG also rose steadily from about 5 million tonnes in 2021 to over 8 million tonnes in 2025.
Natural gas in a gaseous state experienced a more mixed trend. Its import value increased by 19.0%, but the volume dropped by 12.1%. Monthly averages reflect this trend: value rose modestly from about €5 billion in 2024 to over €5 billion in Q1 2025, while the volume fell from around 9 million tonnes to just over 8 million tonnes. A more dramatic drop was seen when compared to 2021, when gaseous gas volumes peaked at over 15 million tonnes monthly.
When comparing monthly averages in the first quarter of 2025 with full-year 2024 averages, LNG imports stood out. There was a 55.0% increase in value and a 24.7% increase in volume for LNG. At the same time, petroleum oil imports dropped by 9.4% in value and 7.1% in volume. Gaseous natural gas imports saw a 6.4% increase in value but a significant 13.8% decline in volume.
In terms of import partners, the United States was the largest supplier of petroleum oils to the EU in Q1 2025, accounting for 15.0% of imports by value. Norway followed closely at 13.5%, and Kazakhstan contributed 12.7%. For liquefied natural gas, over half (50.7%) of imports came from the United States, demonstrating a strong transatlantic energy link. Russia was the second-largest LNG supplier with a 17.0% share, followed by Qatar at 10.8%.
Regarding natural gas in a gaseous state, Norway played a dominant role, supplying 52.6% of the EU’s imports. Algeria was the second-largest provider at 19.4%, ahead of Russia, which accounted for 11.1%.
The data from Q1 2025 highlights an ongoing shift in the EU’s energy import patterns. While petroleum oils remain the largest energy product by both value and volume, their share is declining, giving way to growing LNG imports. This change is influenced by global energy prices, evolving geopolitical dynamics, and the EU’s strategic pivot toward diversifying its energy mix and enhancing supply security.
Disclaimer: The data and interpretations in this article are based on the latest figures from the first quarter of 2025. Energy markets remain volatile and subject to change due to geopolitical events, policy shifts, and global supply-demand dynamics. For the most up-to-date and detailed insights, readers should refer to official releases from Eurostat or other EU energy authorities.

