

Euro Area Government Debt Rises to 88% of GDP in Q1 2025:In Q1 2025, the euro area’s government debt to GDP ratio rose to 88.0%, while the EU-wide average reached 81.8%, according to Eurostat. This blog covers detailed debt data for all EU Member States, including top and lowest debt holders, quarterly and annual changes, debt composition, and intergovernmental lending figures.
Euro Area Government Debt Rises to 88% of GDP in Q1 2025
Euro Area Government Debt: At the end of the first quarter of 2025, the general government gross debt to GDP ratio in the euro area (EA20) stood at 88.0%, according to Eurostat, the statistical office of the European Union. This marked a modest increase from 87.4% recorded in the previous quarter, Q4 2024. The EU as a whole also experienced an increase, with its debt ratio climbing from 81.0% to 81.8% during the same period.
When compared with the first quarter of 2024, both regions saw year-on-year increases. The euro area ratio edged up from 87.8% to 88.0%, while the EU’s figure rose from 81.2% to 81.8%, highlighting a broader trend of rising public debt across the bloc.
The composition of government debt in both regions remains similar. In the euro area, debt securities accounted for 84.2% of the total debt. Loans comprised 13.3%, while currency and deposits made up 2.6%. In the EU overall, the debt was composed of 83.6% debt securities, 13.9% loans, and 2.5% currency and deposits.
Eurostat also published figures on intergovernmental lending (IGL), which reflects loans between EU Member States. At the end of Q1 2025, IGL as a percentage of GDP stood at 1.4% in the euro area and 1.2% in the EU. These figures underscore the continued role of financial support mechanisms within the union, especially for more indebted or financially stressed countries.
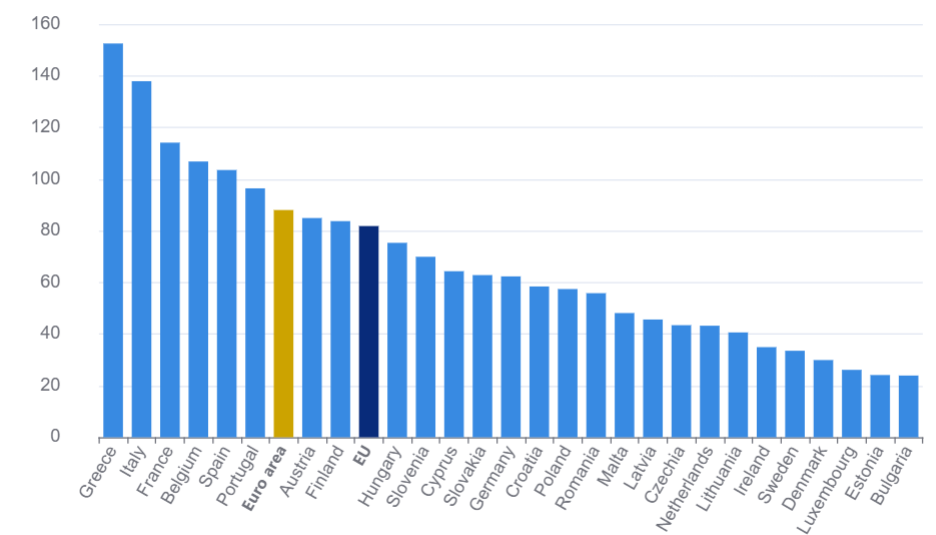
Across individual Member States, the variation in debt ratios was substantial. Greece reported the highest government debt to GDP ratio at 152.5%, maintaining its position as the most indebted country in the EU. Italy followed with 137.9%, while France ranked third at 114.1%. Other countries with notably high ratios included Belgium (106.8%) and Spain (103.5%). On the opposite end of the spectrum, the lowest debt levels were recorded in Bulgaria (23.9%), Estonia (24.1%), Luxembourg (26.1%), and Denmark (29.9%).
When compared with the fourth quarter of 2024, sixteen Member States saw their debt to GDP ratios rise in Q1 2025. Austria and Slovakia registered the highest increases at +3.5 percentage points each. Slovenia followed with a rise of +2.9 pp, while Italy saw an increase of +2.5 pp. Lithuania and Poland each posted gains of +2.4 pp and +2.2 pp, respectively. Belgium also saw a significant increase of +2.1 pp.
Ten Member States recorded a decline in their ratios over the quarter. Ireland saw the most substantial decrease at -3.7 percentage points, followed by Latvia (-1.2 pp) and Greece (-1.1 pp). Czechia’s debt ratio remained stable during this period, marking no change from the previous quarter.
Euro Area Government Debt:On a year-on-year basis, thirteen Member States registered an increase in their debt to GDP ratio at the end of the first quarter of 2025. Poland led with the sharpest rise, jumping by +6.1 percentage points. Finland followed with a +5.1 pp increase. Austria and Romania both saw rises of +4.1 pp, while France’s ratio grew by +3.6 pp. Italy’s debt ratio rose by +2.9 pp, Slovakia by +2.6 pp, and Sweden by +2.0 pp.
Euro Area Government Debt:Twelve Member States successfully reduced their debt ratios over the year. Greece recorded the largest drop, with a notable -9.3 percentage point decline, suggesting continued efforts toward fiscal consolidation. Cyprus followed with -8.2 pp, and Ireland posted a -6.1 pp drop. Other countries that managed to reduce their ratios included Croatia (-3.6 pp), Denmark (-3.2 pp), Spain (-2.8 pp), and Portugal (-2.7 pp). Slovenia and Estonia reported no change compared to the same quarter last year.
Euro Area Government Debt:The chart published by Eurostat visually illustrates these differences across Member States, with clear disparities in fiscal positions. Southern European nations such as Greece, Italy, and Spain continue to face high debt burdens, while several Eastern and Northern European countries maintain more conservative fiscal profiles.
Euro Area Government Debt:Euro Area Government Debt:These figures reflect the continued challenge of managing public finances in a period marked by economic uncertainty, global inflation, shifting interest rates, and geopolitical tensions. The rise in government debt also reflects the lingering fiscal impact of post-pandemic support measures, energy subsidies, and rising social expenditure.
Euro Area Government Debt: Going forward, the fiscal strategies adopted by Member States will be critical in determining whether these debt ratios stabilize or continue to rise. Policymakers will also need to balance fiscal consolidation with the need to support growth, infrastructure development, and resilience in an increasingly complex global economic environment.
Disclaimer:
All data used in this blog is sourced from Eurostat, the statistical office of the European Union. Figures represent the general government gross debt to GDP ratio at the end of Q1 2025.