

Between 2000 and 2024, EU industrial production grew at an average rate of 0.6% per year. While Ireland and Poland saw the fastest growth, Italy and Portugal recorded the slowest, even showing negative trends. The 2008 financial crisis and the 2020 COVID-19 pandemic caused major disruptions, with only partial recoveries afterward. The data reveals sharp contrasts in industrial performance across EU countries.
EU Industrial Production Trends (2000–2024)
Industrial production across the European Union has grown at an average annual rate of 0.6% between 2000 and 2024, according to Eurostat data. This growth, while steady, reflects a mixed performance among individual EU member states, with some countries significantly outperforming the average and others witnessing stagnation or decline.
In the early 2000s, the Union’s industrial production was on an upward trend, averaging 2.0% annual growth. However, this trajectory was disrupted by the global financial crisis of 2007–2008, which triggered double-digit declines in industrial output across several member states. Even countries that had shown strong growth prior to the crisis were severely affected.
Post-crisis recovery efforts led to a moderate rebound in the 2010–2019 period, although the growth rates during this phase were only about half of what was observed before the financial turmoil. The momentum was again interrupted in 2020 as the COVID-19 pandemic led to a sharp 7.4% drop in industrial production across the EU. From 2021 to 2024, the region experienced a slight annual decline of 0.4% in production, underscoring the persistent challenges faced by the industrial sector.
At the national level, Ireland and Poland have emerged as the standout performers. Ireland, in particular, registered an impressive 5.6% average annual growth in industrial production over the 24-year period. The country saw remarkable acceleration post-2014, with a noticeable surge after 2020, peaking near 400% of its 2000 production level before a slight pullback in 2023–2024. Poland followed closely with a 4.9% annual growth rate, maintaining a relatively consistent upward trajectory throughout the entire period.
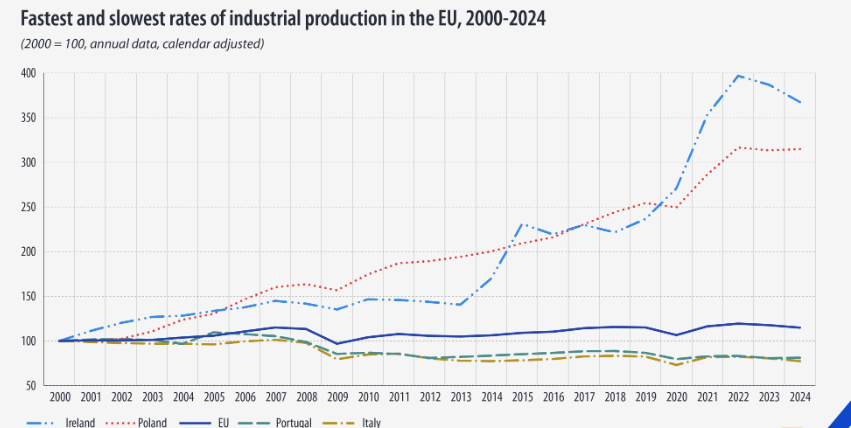
On the other end of the spectrum, Italy and Portugal reported negative growth rates. Italy’s industrial production declined by an average of 1.1% per year, while Portugal saw a 0.9% annual decline. Both countries have remained below their 2000 production levels since the financial crisis, struggling to regain lost ground. This long-term stagnation stands in contrast to the EU average and the dynamic performance of some Eastern and Northern European economies.
The EU as a whole has shown modest improvements post-2010, but it still trails behind the high-growth countries in terms of industrial performance. The data highlights the diverging paths within the bloc, with structural reforms, innovation strategies, and economic resilience playing key roles in determining each country’s industrial trajectory.
As of 2024, the industrial production index (2000 = 100) illustrates these differences starkly: Ireland is approaching a level of 370, Poland has crossed 310, the EU average stands near 115, while Italy and Portugal hover close to 80.
These findings underscore the need for targeted policy measures to boost industrial capacity in lagging nations and ensure a more balanced industrial recovery across the European Union.
Disclaimer:
This article is based on publicly available data from Eurostat and is intended for informational and educational purposes only. It does not constitute financial, investment, or economic advice. Readers are encouraged to consult official sources or economic experts before making any decisions based on this information.