
Euro Area Inflation Steady at 2.0%:Euro area inflation remained stable at 2.0% in July 2025, but deeper data shows diverging trends. Food and services inflation continued to rise, while energy prices dropped sharply. This blog explores detailed inflation rates across categories like unprocessed food, services, energy, and non-energy goods, along with country-wise inflation data from Belgium to Finland.
Euro Area Inflation Steady at 2.0% in July 2025
Euro Area Inflation:Euro area inflation remained unchanged at 2.0% in July 2025, maintaining the same pace as in June, according to the latest flash estimate released by Eurostat, the statistical office of the European Union. This steady annual inflation rate marks a period of relative stability for the euro area after a year of uneven price movements.
Despite the stable headline figure, the inflation composition reveals significant underlying shifts. While food and services continue to see price pressures, the energy sector is playing a crucial deflationary role. These diverging trends are critical for policymakers, especially the European Central Bank (ECB), as they consider future monetary decisions.
Food, Alcohol & Tobacco Lead Inflation Components
Euro Area Inflation:Among the various components that make up the Harmonised Index of Consumer Prices (HICP), food, alcohol and tobacco saw the sharpest annual rise in July 2025, recording a 3.3% increase compared to 3.1% in June. This category has now surpassed services as the leading contributor to inflation in the euro area.
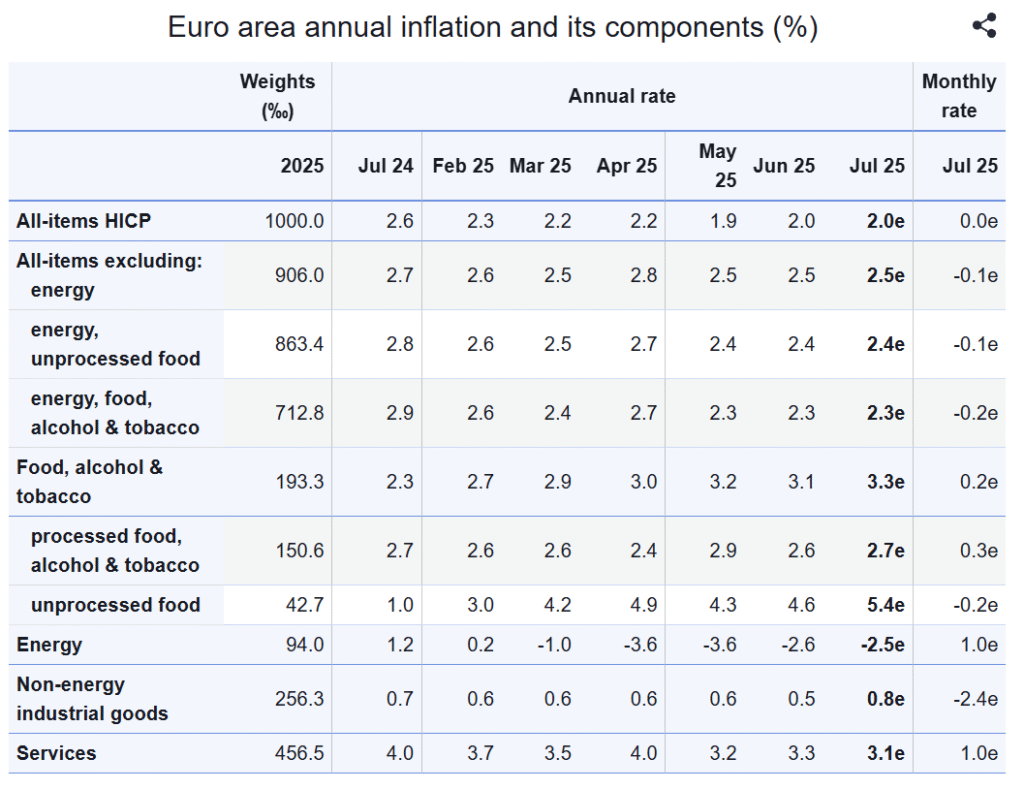
Within the food category, unprocessed food inflation stood out with an alarming annual rate of 5.4%, the highest of all components. However, due to its smaller weight in the overall index (42.7‰), its broader impact is relatively contained. Processed food, alcohol and tobacco saw a 2.7% annual increase, continuing its gradual upward trend from 2.6% in June and 2.4% in May.
The broader category of food, alcohol and tobacco carries a weight of 193.3‰ in the HICP, indicating its substantial influence on overall inflation dynamics.
Services Inflation Remains Elevated
Euro Area Inflation:Services Euro Area Inflation inflation, a persistent inflationary component due to higher wage costs and resilient consumer demand, registered at 3.1% in July. This is a slight decline from 3.3% in June, but still higher than the overall headline rate of 2.0%. The services sector, with a weight of 456.5‰ in the inflation basket, continues to anchor core inflation and makes up nearly half the core HICP.
The month-on-month increase in service prices was 1.0%, highlighting the continued price pressure in this sector despite broader inflation stability.
Energy Prices Continue to Decline
Euro Area Inflation:The most significant downward pressure on inflation continues to come from the energy sector. Energy prices fell by 2.5% year-on-year in July, a marginal improvement from the 2.6% decline recorded in June. This marks several consecutive months of negative energy inflation, reflecting declining global oil and gas prices and increased energy efficiency across the eurozone.
With a weight of 94.0‰, energy is not the largest component, but its impact is disproportionately felt due to its volatility and influence on transport and production costs. The monthly rate for energy inflation rose by 1.0% in July, indicating a potential shift that markets and policymakers will closely watch.
Non-Energy Industrial Goods See Modest Uptick
Euro Area Inflation:Non-energy industrial goods (NEIG) registered a 0.8% increase in annual inflation in July, up from 0.5% in June. While still modest, this marks the first meaningful uptick in this category after several months of subdued price movement. Monthly, however, this category saw a sharp decline of 2.4%, suggesting temporary factors such as seasonal discounts or supply chain adjustments.
This category includes manufactured goods like clothing, electronics, and appliances, and holds a weight of 256.3‰ in the inflation basket.
Core Inflation Stable, Excluding Energy
Euro Area Inflation:When energy is excluded from the inflation calculation, the euro area recorded a 2.5% annual inflation rate in July, slightly above the headline rate. This underscores the ongoing price pressure in other sectors like food and services. Similarly, the index excluding energy, food, alcohol and tobacco stood at 2.3% in July, unchanged from June, reinforcing that underlying inflation remains persistent.
Inflation Trends by Country
Euro Area Inflation:Inflation across individual eurozone countries showed substantial divergence in July 2025. Belgium recorded the highest inflation at 5.4%, followed closely by Estonia at 5.6% and Croatia and Slovakia at 4.5% each. These countries are grappling with elevated food and energy costs, alongside local economic pressures.
At the other end of the spectrum, Finland (0.5%), Latvia (0.8%), and Ireland (1.5%) saw the lowest inflation rates in the euro area. These countries benefited from more subdued domestic demand and efficient energy policies.
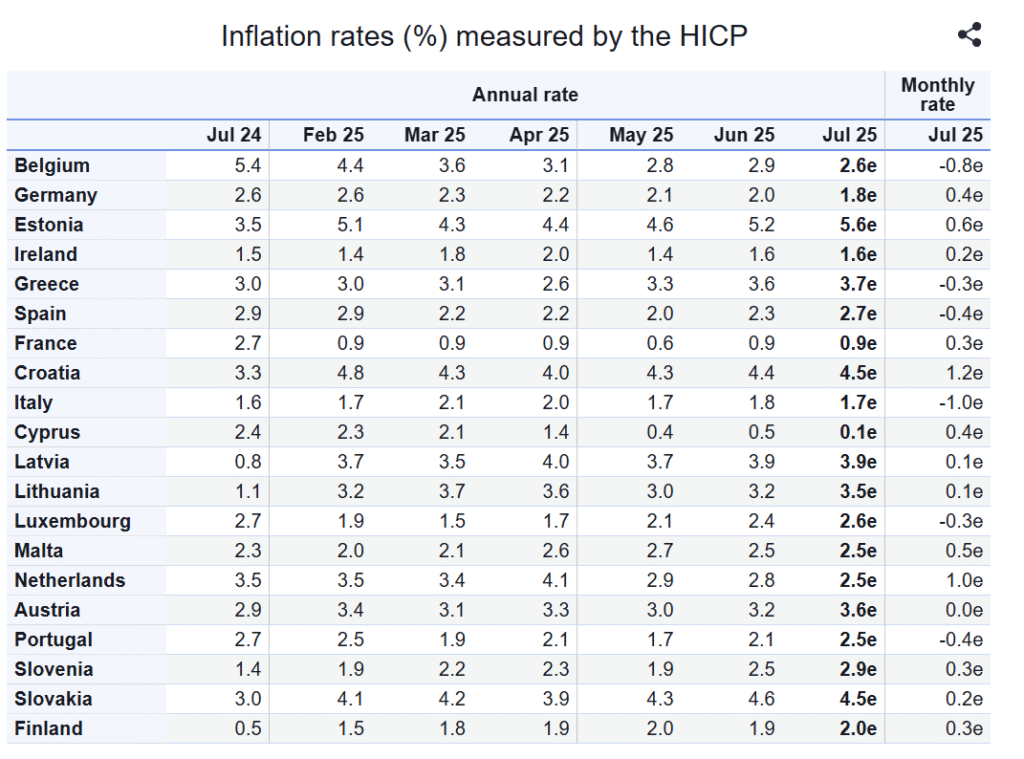
Germany, the largest economy in the eurozone, reported an annual inflation rate of 2.6%, slightly above the euro area average, while France came in significantly lower at just 0.9%. Italy reported 1.6% inflation, pointing to a relatively controlled price environment despite earlier fears of resurgence.
Monthly Inflation Movements
Monthly inflation for the euro area remained at 0.0%, indicating a flat price change from June to July. However, notable movements occurred within individual components and countries.
- Services and energy prices rose by 1.0% each on a monthly basis.
- Processed food, alcohol and tobacco saw a 0.3% monthly increase.
- In contrast, non-energy industrial goods fell sharply by 2.4% month-on-month.
- Country-wise, Italy saw the sharpest monthly decline at -1.0%, while Croatia recorded the highest monthly rise at 1.2%.
Visual Insight: Bar Chart Representation
A Eurostat bar chart clearly illustrates these trends: energy stands out with a deep negative bar at -2.5%, while services and food categories show strong positive contributions. The all-items HICP bar is stable at 2.0%, visually depicting the balance between upward and downward pressures.
July 2025 marks a month of inflation stability in the euro area, with the headline rate anchored at 2.0%. However, the story beneath the surface is more nuanced. Food and services continue to face strong inflationary pressures, while energy prices remain in deflationary territory. These dynamics suggest that while the inflation target has been met, the path forward remains complex.
With core inflation staying sticky and country-level differences widening, the ECB will need to tread carefully. Future policy actions will likely depend on whether food and services inflation continues to rise, and whether energy prices begin to rebound.