
EU current account surplus falls to €81 billion in Q2 2025 amid lower trade in goods and services, with a €38.4 billion services surplus and €85.8 billion goods surplus. Germany, Ireland, and Spain lead surpluses, while France and Romania report large deficits.
EU Current Account Surplus Declines to €81.0 Billion in Q2 2025
The European Union’s current account surplus narrowed significantly in the second quarter of 2025, reflecting weaker trade performance across both goods and services sectors. According to the latest estimates released by Eurostat, the statistical office of the European Union, the seasonally adjusted current account recorded a surplus of €81.0 billion, representing 1.7% of GDP. This marks a notable decline compared to the €113.8 billion surplus (2.5% of GDP) in the first quarter of 2025 and the €120.8 billion surplus (2.7% of GDP) recorded in the same quarter a year earlier.
EU Current and Capital Accounts Overview
During the second quarter of 2025, several key components of the EU’s balance of payments showed a downward trend compared to the previous quarter. The surplus in the goods account decreased sharply from €113.6 billion to €85.8 billion, while the services account surplus fell from €46.4 billion to €38.4 billion.
Meanwhile, the primary income deficit narrowed slightly from €18.6 billion to €14.7 billion, but the secondary income deficit widened marginally from €27.6 billion to €28.5 billion. The capital account, which had posted a small surplus of €0.7 billion in the previous quarter, turned negative with a deficit of €12.3 billion in Q2 2025.
Geographical Breakdown of Trade Balances
Based on non-seasonally adjusted data, the EU recorded strong surpluses in its current account with several key partners. The largest surpluses were registered with the United Kingdom (+€69.5 billion), Switzerland (+€36.3 billion), Canada (+€10.9 billion), Hong Kong (+€9.4 billion), Brazil (+€7.7 billion), offshore financial centres (+€5.4 billion), Japan (+€1.1 billion), and Russia (+€0.8 billion).
On the other hand, significant deficits were recorded with China (-€47.3 billion), the United States (-€13.1 billion), and India (-€2.0 billion). The data reflects the EU’s continued trade dependency with China and the US, despite efforts to diversify export markets and strengthen intra-European trade.
EU Financial Account: Net Direct Investor Status
In terms of financial flows, the EU maintained its position as a net direct investor in the second quarter of 2025. Direct investment assets decreased by €58.8 billion, while liabilities dropped by €68.0 billion, resulting in net outflows of €9.2 billion.
Additionally, portfolio investments saw a net outflow of €19.4 billion, and other investment categories also recorded a net outflow of €22.5 billion, indicating sustained capital movement towards external markets.
Member States’ Current Account Balances
Among EU Member States, fifteen countries recorded current account surpluses, while twelve reported deficits in Q2 2025. Germany led the bloc with the highest surplus at €44.9 billion, followed by Ireland (€19.5 billion), Spain (€14.7 billion), the Netherlands (€13.2 billion), Denmark (€12.0 billion), Italy (€10.7 billion), and Sweden (€7.7 billion).
In contrast, France posted the largest deficit at €11.5 billion, followed by Romania (€7.9 billion), Belgium (€4.5 billion), and Greece (€3.5 billion).
Trends in Euro Area and EU GDP Growth
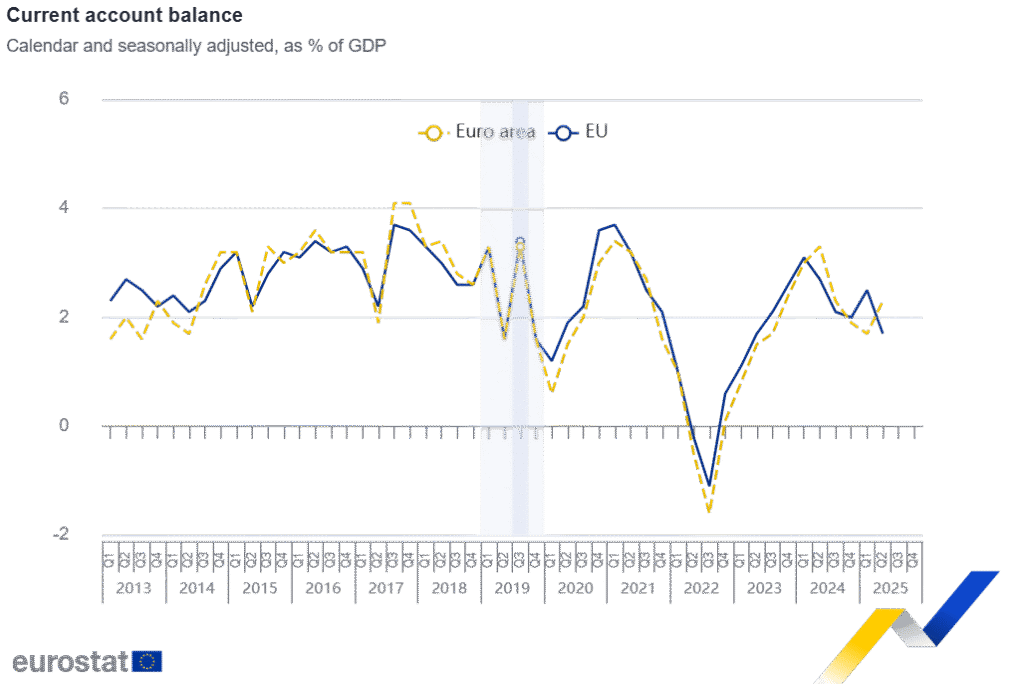
The accompanying chart shows the annual GDP growth trends for both the Euro area and the broader EU from 2013 to 2025. Growth rates have fluctuated within the range of 1.5% to 4% for most of the decade, with a sharp decline in 2020–2021 during the COVID-19 crisis, followed by a strong rebound in 2022–2023. However, growth momentum appears to have moderated again in 2024 and 2025, aligning with the decline in trade surpluses and external demand pressures.
Disclaimer:
This article is based on official data and estimates released by Eurostat for the second quarter of 2025. Figures are subject to revision in future statistical updates.