

U.S Pending Home Sales Drop Sharply: Pending home sales in the U.S. saw a significant decline in April, falling 6.3% from March, according to the latest data. This drop was much steeper than the flat growth Wall Street had been expecting. Compared to April last year, pending sales were down 2.5%.
U.S Pending Home Sales Drop Sharply: Impact Of Stock Market Volatility and Mortgage Rates Impact Demand
Pending home sales in the U.S. saw a significant decline in April, falling 6.3% from March, according to the latest data. This drop was much steeper than the flat growth Wall Street had been expecting. Compared to April last year, pending sales were down 2.5%.
This decline is not entirely unexpected when you consider the market conditions during April. Pending home sales data is based on signed contracts for existing homes, meaning it reflects buyer activity during the month. That period was marked by heightened volatility in the stock market, largely due to ongoing tariff-related news, which in turn pushed the average rate on a 30-year fixed mortgage from 6.6% at the beginning of the month to over 7% by the end.
Regionally, the drop in sales was felt nationwide, but the South and West saw the steepest declines. The South experienced the sharpest price increases since the start of the pandemic and is now seeing some price corrections. Meanwhile, the West remains the most expensive region in the country. Even the Midwest, typically a more affordable market, recorded a noticeable decline in sales—likely due to limited supply following a period of high demand.
Nationwide housing inventory levels have reached a five-year high, yet high mortgage rates are still discouraging many potential buyers. Although prices are easing in some areas, the continued high rates around 7% are causing many buyers to wait on the sidelines in hopes that prices may drop further.
Regionally, the West experienced the sharpest monthly decline, with its index falling to 53.3—a drop of 8.9% from the previous month. The South, despite having the highest index value at 85.9, also saw a significant decrease of 7.7% month-over-month. In the Midwest, the index stood at 73.5, showing a 5.0% decline. Meanwhile, the Northeast had the smallest drop, with its index slipping slightly to 62.1, down just 0.6% compared to March.
These figures indicate that all regions of the country experienced a slowdown in pending home sales in April, with the impact most pronounced in the West and South. Despite regional differences, the elevated mortgage rates and uncertain economic conditions are affecting buyers’ willingness to enter into new contracts across the board.
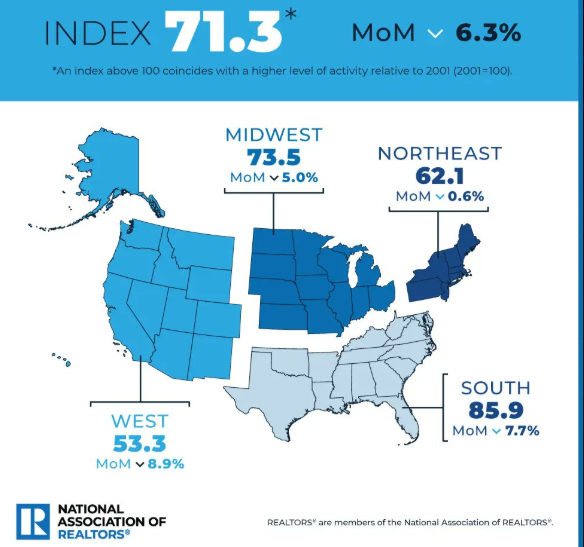
Image credit: National Association Of Realtors
nterestingly, the dynamic between existing homes and new homes is becoming more pronounced. While pending sales for existing homes fell sharply, new home sales rose by 11% month over month in April. This data, also based on signed contracts, reflects the aggressive strategies homebuilders are using to attract buyers.
Builders ended March with a nine-month supply of homes, a substantial inventory. To sell those homes, they offered mortgage rate buy-downs, price cuts, and various incentives. Builders have more flexibility and resources to adjust pricing and financing options, unlike sellers in the existing home market. That flexibility is currently giving the new home market an advantage.
As mortgage rates remain high and uncertainty continues in financial markets, housing trends are likely to remain uneven. Buyers and sellers alike are navigating a complex environment where timing, pricing, and flexibility are more important than ever.