

U.S Households Cut Spending by $29.3 Billion in May 2025:In May 2025, U.S. consumers faced financial pressure as personal income dropped by $109.6 billion and disposable income fell by 0.6%. Consumer spending declined by $29.3 billion, led by steep cuts in motor vehicle and gasoline purchases. While services spending slightly offset the downturn, the overall trend signals tightening household budgets. Here’s a detailed look at the latest data from the U.S. Bureau of Economic Analysis.
U.S Households Cut Spending by $29.3 Billion in May 2025 as Incomes Dip Sharply
In May 2025, the California economy witnessed a noticeable decline in various key financial indicators, as reported by the U.S. Bureau of Economic Analysis. Personal income across the country fell by $109.6 billion, marking a 0.4 percent decrease at a monthly rate. More significantly, disposable personal income (DPI)—which represents personal income after taxes—declined by $125.0 billion, or 0.6 percent.
This downturn in disposable income came alongside a decline in consumer spending and savings metrics, painting a cautious picture of the American household’s financial situation in May.
Personal consumption expenditures (PCE), a critical measure of consumer spending, dropped by $29.3 billion or 0.1 percent. The overall decline in PCE was primarily driven by a sharp $49.2 billion fall in spending on goods. However, this decline was partially cushioned by a $19.9 billion increase in spending on services.
Breaking down the goods category, the most significant reduction was seen in spending on motor vehicles and parts, which plummeted by $49.3 billion. Spending on gasoline and other energy goods also fell sharply, declining by $19.8 billion. Meanwhile, consumers spent $1.8 billion less on food and beverages.
On the services side, the data showed mixed results. While there were declines in areas like food services and accommodations (-$10.6 billion), financial services and insurance (-$5.7 billion), and transportation services (-$4.0 billion), these were offset by increases in other service categories. For instance, spending on housing and utilities rose by $13.7 billion, health care expenditures went up by $11.3 billion, and spending on other nondurable goods grew by $8.6 billion.
Additional increases were observed in other services ($6.6 billion), clothing and footwear ($5.3 billion), nonprofit institution expenditures ($5.0 billion), recreational goods and vehicles ($4.1 billion), recreation services ($3.6 billion), and furnishings and durable household equipment ($2.4 billion).
The broader measure of personal outlays—which includes personal consumption expenditures, personal interest payments, and current transfer payments—declined by $27.6 billion during the same period. Despite the fall in income and spending, the personal saving level in May stood at $1.01 trillion.
However, the personal saving rate, defined as personal saving as a percentage of DPI, fell slightly to 4.5 percent. This marked a mild drop from the previous month, reflecting the strain on disposable incomes.
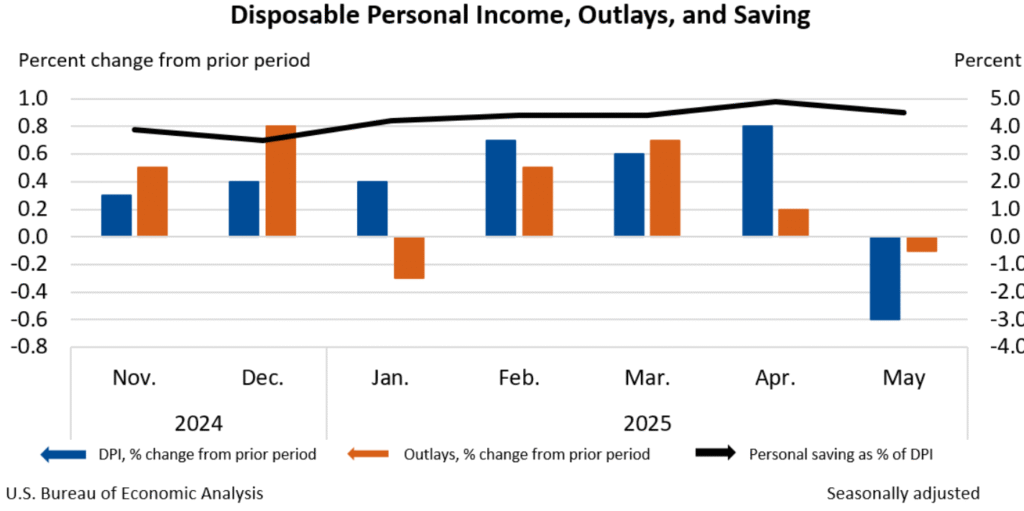
Looking at month-to-month trends from November 2024 to May 2025, disposable personal income (DPI) and personal outlays showed various fluctuations. Notably, DPI increased steadily from November 2024 through April 2025, peaking at an 0.8 percent rise in April before plunging by 0.6 percent in May.
Outlays followed a more erratic path, falling in January, rebounding in February and March, and then dropping again in May by 0.1 percent. The personal saving rate hovered in the range of 4.5 to 5.0 percent over the first five months of 2025, slightly declining in May.
The decrease in current-dollar personal income in May was mainly due to a reduction in government social benefits to individuals and lower income for farm proprietors. These losses were partly offset by an increase in compensation, though not enough to prevent the overall downturn.
Overall, the data from May 2025 signals a slowdown in both income growth and consumer expenditure, with a marked decline in spending on durable goods such as vehicles and energy-related products. This economic snapshot suggests growing financial pressure on households and a possible need for policy attention if the trend persists in the coming months.