
EU Inflation data: Euro area annual inflation rose to 2.0% in June 2025, up from 1.9% in May, while EU-wide inflation reached 2.3%. Romania recorded the highest inflation at 5.8%, and Cyprus the lowest at 0.5%. Services were the largest contributor to euro area inflation, while energy had a deflationary impact. The blog covers all inflation rates by country, major contributing sectors, and changes from previous months, based on official Eurostat data.
EU Inflation(European Countries) Rises to 2.0% in June 2025
EU Inflation in the euro area edged higher in June 2025, climbing to 2.0%, up slightly from 1.9% recorded in May. This modest increase marks a return to the European Central Bank’s inflation target after a year of gradual easing. A year ago, in June 2024, inflation in the eurozone stood at 2.5%. Across the broader European Union (EU), annual inflation also ticked up to 2.3% in June 2025, compared to 2.2% in May and 2.6% a year earlier.
These latest figures were released by Eurostat, the official statistical office of the European Union, and provide insights into how inflation is evolving across the continent as economic pressures linger.
Countries With the Lowest and Highest Inflation
Inflation rates across individual member states continue to vary widely. The lowest annual EU inflation rates in June 2025 were observed in:
- Cyprus: 0.5%
- France: 0.9%
- Ireland: 1.6%
These figures reflect stable consumer price levels in these countries, potentially due to domestic fiscal policies and energy price dynamics.
On the other end of the spectrum, the highest inflation rates were recorded in:
- Romania: 5.8%
- Estonia: 5.2%
- Hungary and Slovakia: 4.6% each
These elevated rates suggest persistent inflationary pressures in Eastern Europe, possibly driven by supply-side constraints, wage growth, or external commodity costs.
EU-Wide Changes in Inflation
Compared with May 2025, annual inflation fell in only five EU member states, while it rose in twenty-two. This suggests a broad-based uptick in prices, albeit unevenly distributed across regions. The reasons for these fluctuations likely include variations in national fiscal policies, energy prices, service demand, and the effects of recent wage negotiations in different sectors.
Main Drivers of Euro Area Inflation
In June 2025, the main components contributing to the 2.0% annual EU inflation rate in the euro area were:
- Services: +1.51 percentage points (pp)
- Food, alcohol, and tobacco: +0.59 pp
- Non-energy industrial goods: +0.13 pp
- Energy: -0.25 pp (negative contribution)
This breakdown underscores how services have become the dominant driver of EU inflation across the euro area. Energy, once a primary source of inflationary pressure, has started to exert a slight deflationary effect, reflecting easing oil and gas prices or possibly more stable energy supply chains.
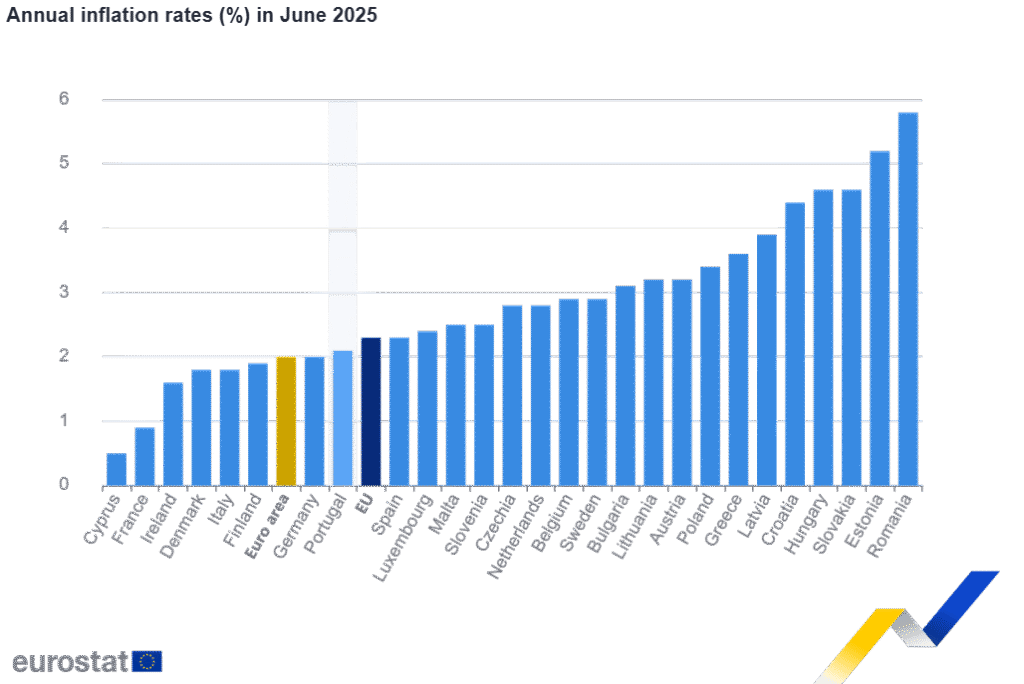
Inflation by Country – Visual Snapshot
The Eurostat chart on annual inflation rates paints a clear picture of the regional disparities. While countries like Germany, Italy, and Finland maintained inflation rates close to or slightly below the euro area average, others such as Poland, Croatia, and the Baltic states experienced inflation levels well above 3%.
Methodology Behind the Numbers
Eurostat calculates inflation using the Harmonised Index of Consumer Prices (HICP). Annual inflation is defined as the change in the price level of consumer goods and services between the current month and the same month in the previous year. Monthly inflation, in contrast, measures the change from the previous month.
Each component’s contribution to overall inflation is calculated using a method that ensures additivity—meaning that when contributions from various categories are added up, they match the total inflation rate.
Geographical Definitions
- The Euro area consists of 20 countries including Germany, France, Italy, Spain, the Netherlands, and others that use the euro as their official currency.
- The European Union (EU) includes a broader group of 27 countries, incorporating both euro and non-euro member states like Denmark, Hungary, Poland, and Sweden.
The composition of these zones can change over time, but the reported data reflects the current member states as of June 2025.
Looking Ahead
Eurostat releases a flash estimate of euro area inflation at the end of each reference month. The flash estimate for June 2025, published on 1 July, matched the final figure of 2.0%. The next flash estimate for July 2025 is scheduled for release on 1 August. of EU Inflation
These EU inflation trends will be closely monitored by policymakers, businesses, and consumers alike as they provide crucial signals on the future path of interest rates, wage negotiations, and purchasing power.